
If your HPLC peaks look wide, fronted, or split, your injection volume might be the quiet culprit — not your column. Getting the volume right is one of the cheapest, fastest wins in method development, and it usually takes less than an hour to test.
The Short Answer
Injection volume should scale with your column’s dimensions: for a standard 4.6 mm ID analytical column, inject roughly 8–40 µL; for a 2.1 mm ID column, keep it to about 1–3 µL; and as a general rule, never exceed 1–2% of total column volume unless your sample solvent is weaker than the mobile phase. When in doubt, start small and double the volume until resolution drops, then back off one step.
Read On
If you’re tired of chasing ghost peaks, flat-topped peaks, or retention times that drift, keep reading. I’ll walk you through the numbers, the injection modes, and the solvent tricks that make a real difference on the bench.
Why Injection Volume Matters More Than You Think
Here’s the thing: your column is a narrow tube packed with particles, and the injection volume is the width of the “plug” of sample you push onto it. If that plug is wide relative to the column’s volume, it dominates the width of every peak you see.
The injection volume affects peak height, peak width, and resolution all at once. Inject too much and you overload the column; the stationary phase at the inlet saturates, and the rest of your sample flows past with less interaction. The result is peak fronting, tailing, or both — plus retention times that shift between injections. This is exactly why increasing the injection volume can actually decrease resolution between closely eluting compounds, as Sigma-Aldrich’s HPLC tips series explains in detail.
The opposite problem is just as real. If you inject too little, your signal-to-noise ratio suffers and trace analytes disappear into the baseline. The sweet spot is a balance between sensitivity and resolution, and it’s surprisingly easy to find.
The Rules of Thumb That Get You 90% There
Most labs don’t need a full calculation — they need a starting point. Here are the numbers I use, and they come straight from column and consumables manufacturers.
Restek’s published guidance for injection volume by column internal diameter (ID) is a great first anchor:
- 2.1 mm ID (30–100 mm length): 1–3 µL
- 3.0–3.2 mm ID (50–150 mm length): 2–12 µL
- 4.6 mm ID (50–250 mm length): 8–40 µL
Notice the pattern: the volume scales with the cross-sectional area of the column, not just its length. If you switch from a 4.6 mm to a 3.0 mm column, you can estimate the new volume by multiplying the old one by the ratio of the radii squared — Restek’s HPLC and UHPLC FAQ page shows this exact calculation with a worked example.
There’s also a second, widely-cited rule of thumb: keep the injection volume at no more than 1–2% of the total column volume when your sample concentration is around 1 µg/µL. For a common UHPLC column (50 × 2.1 mm, about 173 µL total volume), that works out to roughly 1.2–2.4 µL. Sigma-Aldrich’s optimizing injection volume guide walks through that math and gives examples for 3 mm and 4.6 mm columns too.
One important caveat: isocratic runs are far more prone to volume overloading than gradient methods. In gradient elution, analytes focus at the column head as the mobile phase strength ramps up, so you can often get away with larger volumes.
Match the Volume to Your Column — Not Your Habit
If you’ve been injecting 20 µL on every method since 2010, it’s worth checking whether that still makes sense. Columns have gotten narrower and packing particles have gotten smaller, which means the acceptable injection volume has shrunk with them.
The physical reason is simple: the effective column volume is the space actually occupied by the mobile phase, and it depends on the column length, internal diameter, and the porosity of the packing. For a 4.6 mm ID column, you might safely inject 58 µL on a 5 cm column — but drop to 2.1 mm ID and the safe maximum falls to about 12 µL, and for micro-LC at 300 µm ID you’re talking about 250 nanoliters. Wiley Analytical Science’s injection tutorial includes a great figure showing exactly how the maximum injection volume collapses as the column ID shrinks.
The takeaway: when you change column dimensions — or switch from fully porous to core-shell particles — re-check your injection volume. Particle type changes porosity, which changes effective column volume, which changes how much you can inject without band broadening.
Injection Modes: Partial Loop vs Full Loop
Your autosampler also has a say in this. Modern autosamplers typically support two injection modes, and each has a different precision profile.
- Full-loop injection: the sample loop is overfilled by a factor of 3 to 5, so a precise, reproducible volume (equal to the loop size) is injected. Most of the sample goes to waste, but precision is excellent — this is the mode for analytical work where reproducibility matters most.
- Partial-loop injection: only a fraction of the loop is filled, so the whole sample reaches the column with minimal waste. Precision depends on the loop fill factor, the sample volume, and the draw speed — and the peak area stays linear only up to about 50% of the loop volume.
This trade-off is well documented in Wiley Analytical Science’s discussion of injection modes, which shows how partial-loop and full-loop injections compare and why the sample loop contributes to gradient delay volume. If you need maximum precision for quantitative analysis, overfill the loop. If you’re conserving precious sample, partial loop fill is your friend — just don’t push past half the loop volume, or the volume you think you’re injecting stops being accurate.
The Solvent Effect: What You Dissolve In Matters Just as Much
Here’s a mistake I see constantly: someone injects a sample dissolved in 100% acetonitrile into a method that starts at 5% acetonitrile, and then wonders why the first peaks look terrible.
When your sample solvent is stronger than the starting mobile phase, the analytes get “carried” through the column by the solvent front instead of focusing at the head of the column. The result is band broadening, peak splitting, and distorted shapes — especially for early-eluting peaks. Shimadzu’s abnormal peak shapes guide shows side-by-side chromatograms of the same compound injected in matching versus strong solvents, and the difference is dramatic.
Three fixes that actually work:
1. Match the sample solvent to the initial mobile phase wherever possible. 2. If you can’t change the solvent, inject a smaller volume so the solvent effect has less distance to do damage. 3. Use a “dilute and inject double” approach: dilute the sample 1:1 with a weaker solvent like water, and inject twice the volume. You keep the same amount of analyte on-column but cut the solvent effect roughly in half.
There’s a fourth, fancier option: a “sandwich” injection, where the autosampler aspirates water, then sample, then water again, focusing the sample at the column head. The same Shimadzu troubleshooting article covers that technique.
How to Find Your Sweet Spot in One Afternoon
You don’t need a statistics package for this. Here’s the pragmatic protocol I use, adapted from the approach Sigma-Aldrich recommends:
1. Start with the smallest volume your injector can reproducibly inject. 2. Inject, then double the volume and inject again. 3. Keep doubling until you hit 3% of column volume or until resolution between your critical peak pair starts to drop. 4. Back off to the last volume that kept resolution intact.
While you do this, watch two things: the resolution of your most difficult peak pair, and the peak symmetry factor. When you start seeing fronting (symmetry factor below 1.0) or a noticeable drop in efficiency, you’ve found the ceiling.
Also check whether the peak area stays linear with volume. If it doesn’t, you’re probably hitting mass overload — too many micrograms of analyte on the column, not just too many microliters. For a 4.6 mm ID column, a good ceiling is roughly 50 µg of a single compound per injection; reduce that proportionally for narrower columns.
Common Mistakes to Fix Right Now
- Using one volume for everything. A method you inherited may not fit your column. Re-check the numbers.
- Ignoring the sample solvent. Even a perfect injection volume fails if the diluent is much stronger than the mobile phase.
- Blowing past the loop limit. With partial loop fill, staying under 50% of the loop volume keeps the injected amount predictable.
- Changing columns without adjusting volume. New column dimensions, same old injection volume — this causes more “mysterious” peak problems than most people realize.
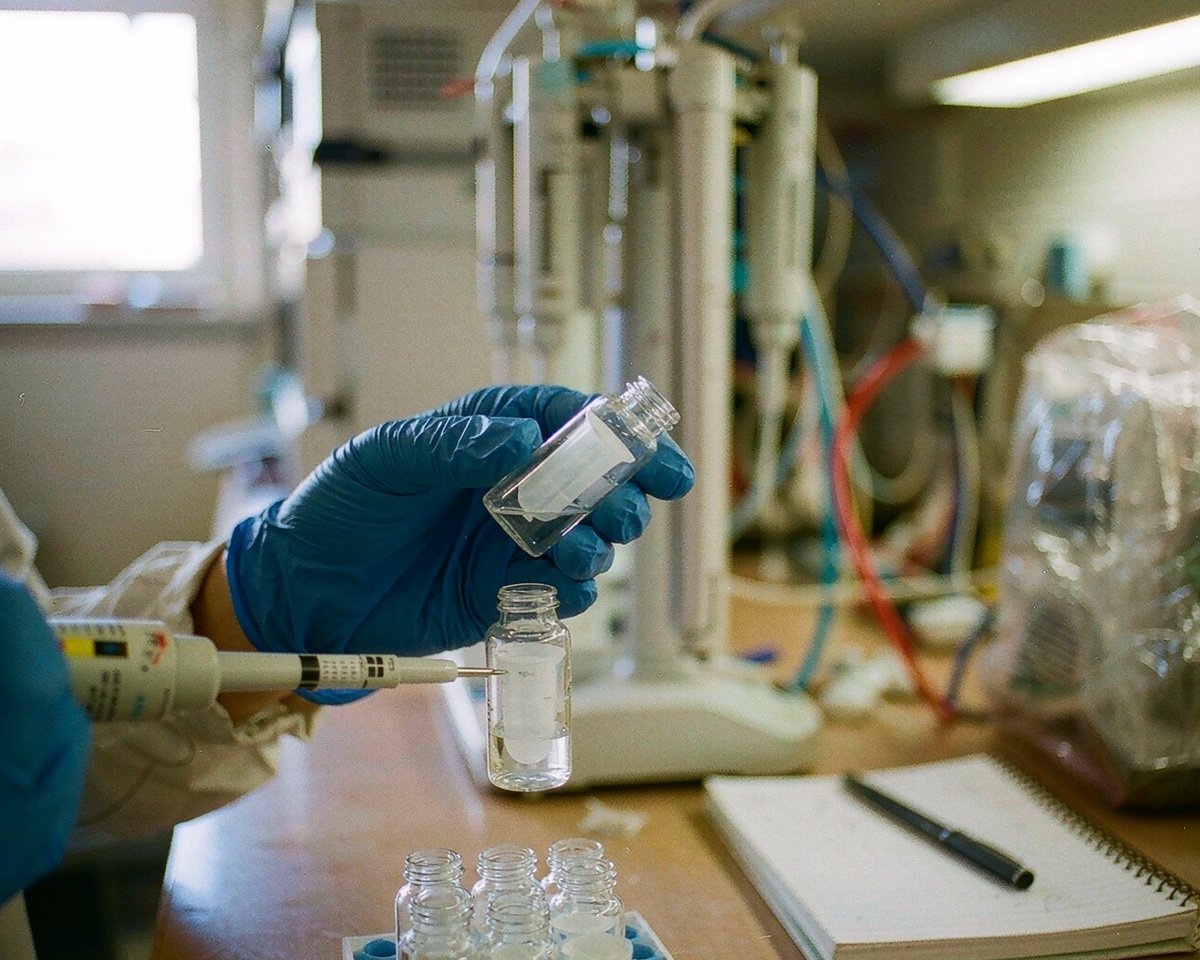
- Forgetting the consumables. The vial and cap you inject from affect reproducibility too — a wobbly cap, a bad septum, or the wrong vial geometry can add variance that no volume tweak will fix. If your injection precision is drifting, check the vial size and geometry for your injection workflow before you blame the method, and make sure you’re using the right HPLC vial for your instrument in the first place.
Conclusion
Injection volume is one of the most underrated dials in liquid chromatography. It costs nothing to change, it’s testable in an afternoon, and it directly controls peak shape, resolution, and sensitivity. The framework is simple: anchor on the column-ID numbers, scale with column volume, respect the 1–2% rule for concentrated samples, match your sample solvent to the mobile phase, and verify empirically by doubling until resolution drops. Get those four things right and you’ll save yourself hours of troubleshooting later.
If your peaks are still misbehaving after fixing the volume, the next places I’d look are your sample prep and your vials. Read about proper sample preparation to tighten up the front end of your workflow, and if you’re pushing sensitivity limits, these LC-MS vial tips will help you squeeze out cleaner, more accurate runs.
Frequently Asked Questions
What is a typical HPLC injection volume?
For a standard 4.6 mm ID analytical column, typical injection volumes range from 8 to 40 µL. For 2.1 mm ID columns, the typical range drops to about 1 to 3 µL. The exact number depends on column length, particle type, and your sample concentration.
What happens if I inject too much volume in HPLC?
Too much volume causes volume overload: peaks broaden, front, or split, retention times may shift, and resolution between closely eluting peaks drops. The stationary phase at the column inlet saturates, so the remaining sample passes through with less interaction.
How do I calculate the right injection volume for my column?
As a rule of thumb, keep the injection volume at 1–2% of the total column volume for samples around 1 µg/µL. For a 50 × 2.1 mm UHPLC column with roughly 173 µL of total volume, that means about 1.2 to 2.4 µL.
Does the sample solvent affect how much I can inject?
Yes, significantly. If your sample solvent is stronger than the starting mobile phase, analytes get carried through the column instead of focusing at the head, causing band broadening. Matching the solvent to the mobile phase — or injecting a smaller volume — lets you inject more without losing resolution.
What is the difference between partial loop and full loop injection?
Full-loop injection overfills the sample loop by 3 to 5 times, giving maximum precision at the cost of sample waste. Partial-loop injection uses only part of the loop, conserving sample, but precision depends on the fill factor and volume — and it stays linear only up to about 50% of the loop volume.