Performing the chromatography is one thing, but analyzing the resulting chromatogram is another. Measuring the peak height and area is required in performing reliable analyses of the sample.
Of course, peak height is a value needed to compute the area, but there is more to it than that.
Read more on the details below explaining peak height and area computation in chromatography.
Ideal vs. Real-life Chromatograms
Calculating the area of a peak in a chromatogram can be as simple as performing manual or relatively simple computations, but complex ones require software to do the same job.
Whatever the method, they follow the same principle of area computation and may need adjustments that require an understanding of the subject, whether you use commercial, open-source, or your own software.
A Gaussian peak or curve is perfectly symmetrical, therefore not having “shoulders,” “flat tops,” or “tailings.” This is to be expected when there are no impurities, leakages, and changes in detector response and operational parameters.
Gaussian peaks, therefore, are practically textbook examples of chromatograms most of the time, while non-Gaussian peaks are common in real-world applications, especially when lab equipment preparation is either unavoidable or simply clumsy.
Peak shapes can differ, but this is a whole new topic in itself. LCGC has a detailed explanation here.
Why do I need to measure Peak Height in Chromatography
The peak height can be a basis itself of quantitative computations, but it can further be used for the computation of the peak’s area.
It is usually measured by electronic means through software.
Peak height is only measured and not computed unless there is a correction algorithm taken into factor for the presumed base.
A paper published in the journal Analytical Chemistry compared three baseline correction algorithms which you can read here.
Why do I need to calculate Peak Area in Chromatography
Calculating the peak area rather than relying on the peak height alone is advantageous when column temperature cannot be controlled at all times. A temperature decrease will also reduce the peak height since there is an increase in retention time and band width.
HPLC is more useful than traditional chromatography methods that use lower pressures, but temperature plays a critical role. Fluctuations in the temperature of the system or a lab that is not temperature-controlled will surely make a difference in the results due to modified retention time.
Peak area computation is used to determine the relative amounts of components in a compound sample and other quantitative calculations.
Traditionally, strip chart recorders are used to record data, so computations made using peak heights or amplitude are considered valid. Technology has advanced, and we can now measure peak area for more accurate estimates.
How to compute Peak Area for Ideal Chromatograms
Before we compute, let us first discuss the parts of a peak in a chromatogram.
The actual area of a peak is proportional to the amount of that component in a given sample, so some peaks can be more prominent while others can be very small.
Regardless, all of them have imaginary baselines, from which the lower parts similar to troughs in waves rise from or descend into.
The crest area of a peak determines its height, from which the width at half height is measured.
A simple computation for estimation of the peak area can be stated as area (a) is equal to the height of the peak (h) times the width measurement at half height (w).
If we would manually measure a small peak by enlarging it, we should also enlarge the others at the same factor so we can still compute for their relative areas.
How to compute Area of Irregular Peaks
The computation of peaks that have irregular shapes still follows the same principles as those with regular shapes but have a different methodology.
Specialized software
Whether you use open source, commercial, or even your own software produced by coding, they all use computations through calculus or peak integration.
These are governed by algorithms that harness the computing power of available technologies to compute the area on a per-part basis.
Some examples are HappyTools, ThermoFisher Chromeleon, and Waters Empower.
Arts and crafts method
I’ll illustrate this method by telling a hypothetical story. Let’s say that one very destructive computer malware has penetrated all of the laboratories around the world, thereby rendering special computation software useless.
The year is 2099, and the Earth is approaching the next century with a peculiar problem: bodies of water become complexly polluted, and there is a race to understand what is really happening even before a solution is formulated.
You work at NatureXY Solutions, the leading biotechnology company in the world. The company has pledged to devote all of its resources and best scientists in collaboration with scientific communities around the world.
Despite the pour of all efforts, each day passed with no progress. But just like the greatest inventions in history, you came across a serendipitous discovery.
You have accidentally dropped a mixture of waste materials into the water test room. You thought that you were going to set back the experiment by three weeks, but you saw in your own eyes a startling discovery.
Particles in the water coagulated and turned a portion of the water clean, only for it to stop at certain boundaries and revert back to its previous state as if there was a magic spell.
You quickly gathered your coworkers and started to brainstorm the possibility of making a miracle potion.
In your discussion, you discovered that the contents of the waste bottle you broke are only part of a bigger one that got disposed of earlier. It has complete labels, but unfortunately, it seems unlikely by the appearance of the liquid.
Someone must have swapped some bottles and unintentionally combined unidentified waste mixtures.
Without wasting any more time, you started an HPLC experiment to determine the composition of the compound X.
Just as you are completing your initial test, the lab experienced a momentary power shutdown followed by the kicking in of the backup power.
You then discovered that software developed by PenguinPigeon&Duck, one of the leading integrated software developers in your region, has been locked.
You remained calm and finished a rerun of your experiment, but now you don’t have access to the computation software.
Thinking that the problem was isolated, you printed the results and dashed to the old laboratory room in the company’s basement.
While your team checked the possible compounds, you worked on getting the ratio of each one of the peaks.
Here’s how you do it:
You cut each part of the paper and used the analytical balance to weigh them.
You also measured a rectangular piece of the same paper to get the conversion factor from weight to area.
Thank goodness there’s still an offline computer with Microsoft 2040 installed in it with a lifetime license, and you happily computed the proportion of the compounds.
Your coworkers have now identified 99 percent of the compounds, and you were able to generate the majority of the formula.
Now you just have to deal with the remaining one percent in order to save humankind.
May we see a continuation of this story in future articles.
As with the old times, you can also get creative by printing the results and cutting the portions of the different peaks and weighing them in an analytical balance.
Through that method, you can still get their relative amounts in percentage, even though you used milligrams for the computation.
May your future self see this article just in case such a scenario ever takes place.
Dimensional analysis considerations for the unit of computed area
You might be wondering if there is one correct unit for the area of the peak, given that the x-axis is measured in time while the y-axis can simply be expressed in millimeters (mm) or any specified unit.
The answer is none, but it can be expressed as the product of the units of the x-axis and the y-axis.
For beginners who might be confused, you can use dimensional analysis, which is also known as the unit factor method or factor-label method.
If the x-axis is expressed in minutes and the y-axis is expressed in milli-Absorbance units, then the area will simply be expressed as mAu*min.
What is peak integration?
It is a process that is utilized by software specialized in chromatography. To make a more precise measurement, the area of the peak is separated into small unit rectangles. The total areas of these unit rectangles are then added to produce the peak’s area.
Conclusion
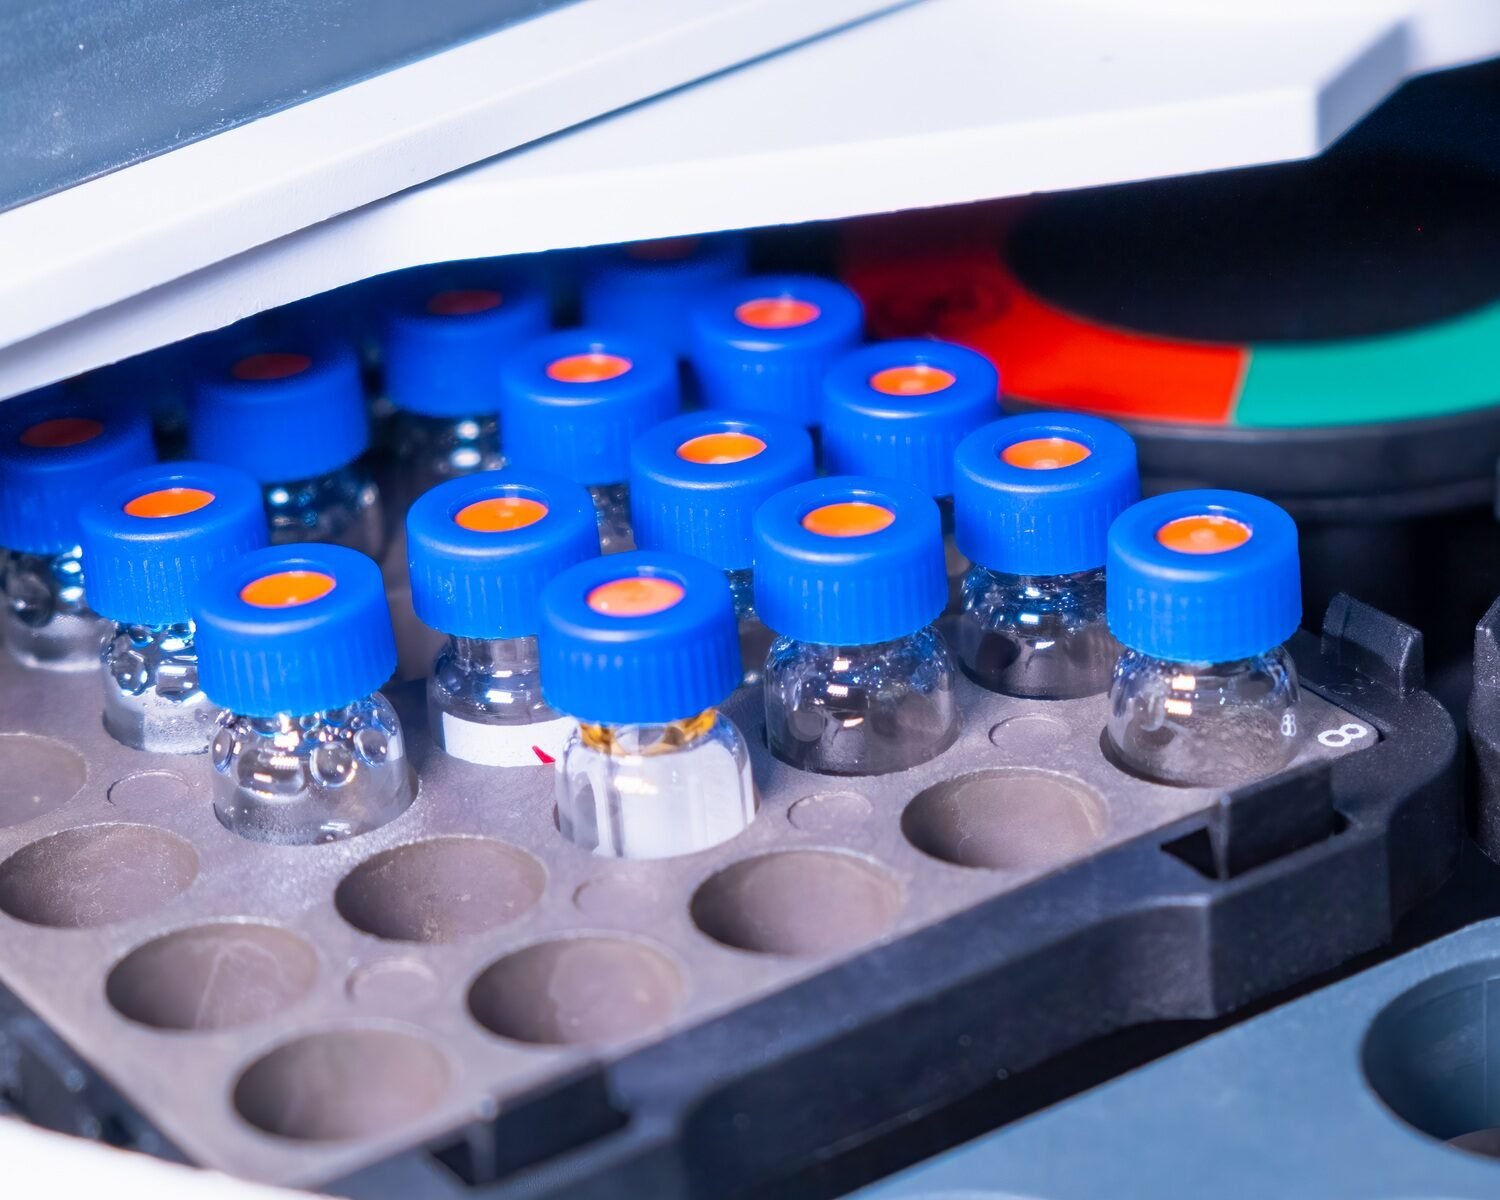
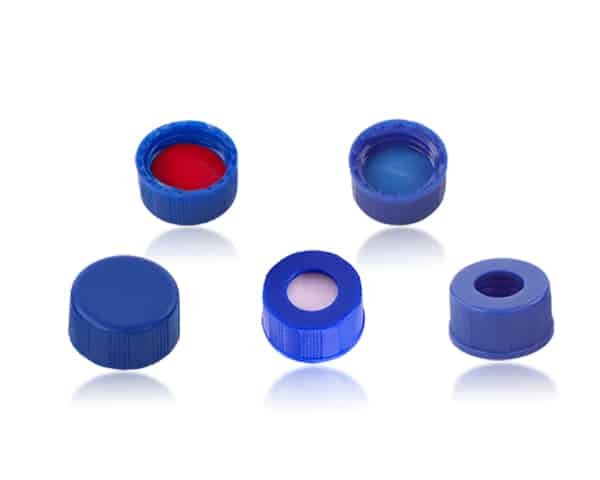
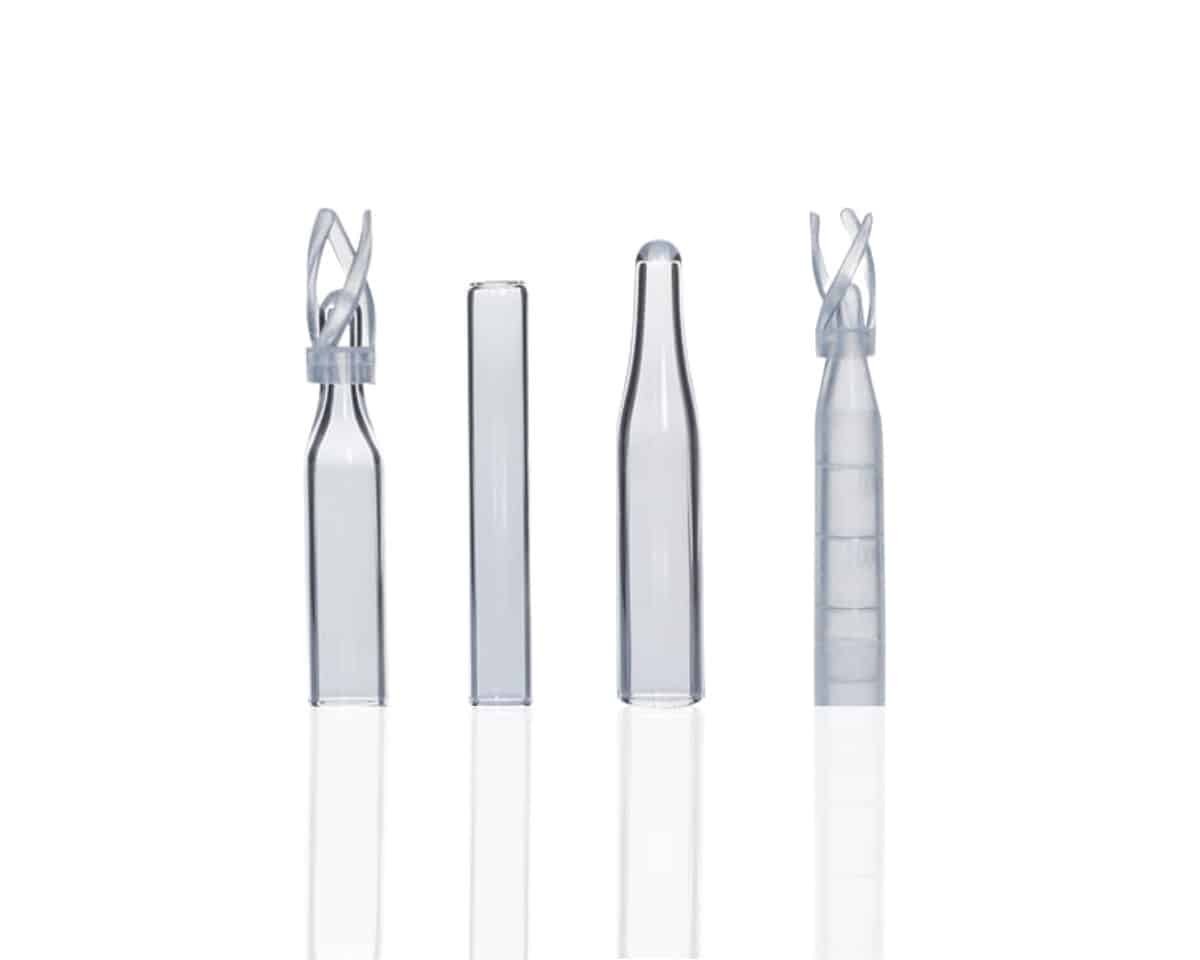
In order to decrease your chances of getting irregular peaks in your chromatography experiments caused by impurities and leakages, you should use high-quality materials.
We at Mastelf offer a wide variety of vials for all types of experiments you can imagine.
Consult today for your laboratory needs by sending us a message.